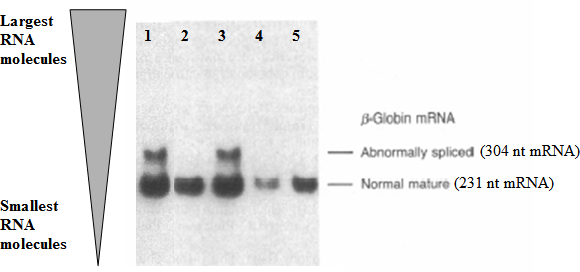
Figure 6-1. RNA Hybidization Analysis of Tazswana’s RNA. The grey triangle indicates relative size of nucleic acids: larger RNA molecules migrating higher in the gel than smaller RNA molecules. Lane 1, Mr. William’s RNA sample (father). Lane 2, Mrs. William’s RNA sample. Lane 3, Tazswana’s RNA (note the two bands, one is correct size, but is also defective). Lane 4, Tazswana’s Grandmother (see Handout 2: Beta-Globin Inheritance). Lane 5, control patient with two wild-type alleles (lacking any thalassemia phenotypes). [Credit: This figure has been modified from Figure 4 in Antonarakis, S.E., et al., β-Thalassemia in American Blacks: Novel mutations in the “TATA” box and an acceptor splice site. Proc Natl Acad Sci USA, 1984. 81(4): p. 1154–8.]
